Last Updated on November 17, 2020 by Admin
27.2.14 Lab – Isolate Compromised Host Using 5-Tuple Answers
Lab – Isolate Compromised Host Using 5-Tuple (Answers Version)
Answers Note: Red font color or gray highlights indicate text that appears in the Answers copy only.
Objectives
In this lab, you will review logs that were gathered during the exploitation of a documented vulnerability to determine the compromised hosts and file.
Part 1: Review Alerts in Sguil
Part 2: Pivot to Wireshark
Part 3: Pivot to Kibana
Background / Scenario
The 5-tuple is used by IT administrators to identify requirements for creating an operational and secure network environment. The components of the 5-tuple include a source IP address and port number, destination IP address and port number, and the protocol in use in the data payload. This is the protocol field of the IP packet header.
In this lab, you will also review the logs to identify the compromised hosts and the content of the compromised file.
Required Resources
- Security Onion virtual machine
Instructions
After the attack, the users no longer have access to the file named confidential.txt. Now you will review the logs to determine how the file was compromised.
Note: If this was a production network, it is recommended that analyst and root users change their passwords and comply with the current security policy.
Part 1: Review Aerts in Sguil
- Launch the Security Onion VM and log in. Log in with the user analyst and password cyberops
- Open Sguil and log in. Click Select All to select the interfaces and then Start SGUIL.
- Review the events listed in the Event Message column. One of these messages is GPL ATTACK_RESPONSE id check returned root. This message indicates that root access may have been gained during an attack. The host at 209.165.200.235 returned root access to 209.165.201.17. The alert ID 5.1 is used as an example in this lab.
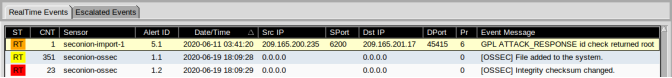
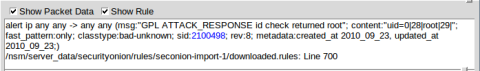
- Select the Show Packet Data and Show Rule checkboxes to view each alert in more detail.
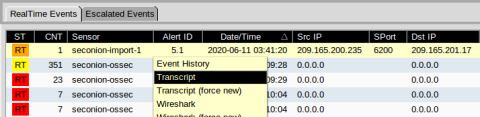
- Right-click the alert ID 5.1 and select Transcript.
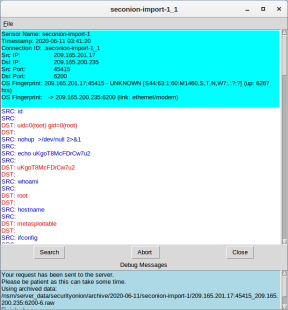
- Review the transcripts for the alert. The transcript displays the transactions between the threat actor source (SRC) and the target (DST) during the attack. The threat actor is executing Linux commands on the target.
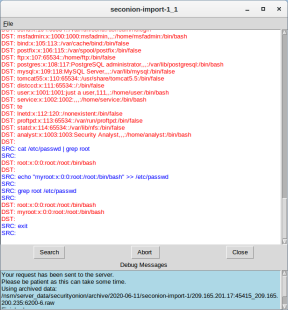
Question:
What kind of transactions occurred between the client and the server in this attack?
Type your answers here.
The attacker from 209.165.201.17 gained root access to 209.165.200.235. The attacker proceeds to browse the file system, copy the shadow file and edited /etc/shadow and /etc/passwd.
Part 2: Pivot to Wireshark
- Select the alert that provided you with the transcript from the previous step. Right-click the alert ID 5.1 and select Wireshark. The Wireshark main window displays three views of a packet.
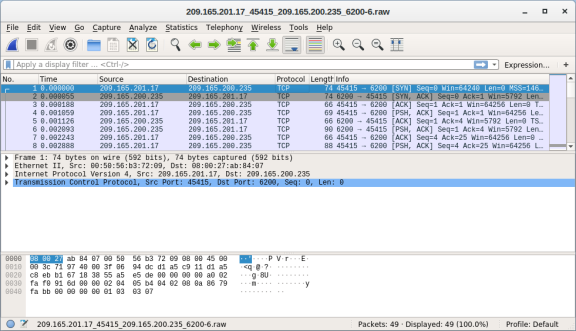
- To view all packets that are assembled in a TCP conversation, right-click any packet and select Follow > TCP Stream.
Question:
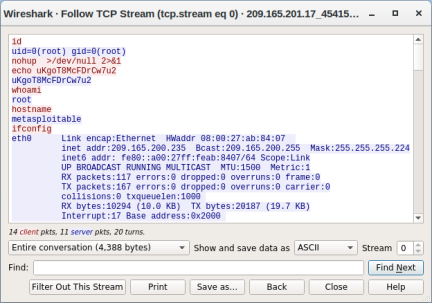
What did you observe? What do the text colors red and blue indicate?
Type your answers here.
The TCP stream shows the transaction between threat actor displayed in red text and the target in blue text. The information from the TCP stream is the same as in the transcript. The hostname of the target is metasploitable and its IP address is 209.165.200.235.
The attacker issues the whoami command on the target. What does this show about the attacker role on the target computer?
Type your answers here.
The attacker has full root privileges on the target computer.
Scroll through the TCP stream. What kind of data has the threat actor been reading?
Type your answers here.
user account information
- Exit the TCP stream window. Close Wireshark when you are done reviewing the information provided.
Part 3: Pivot to Kibana
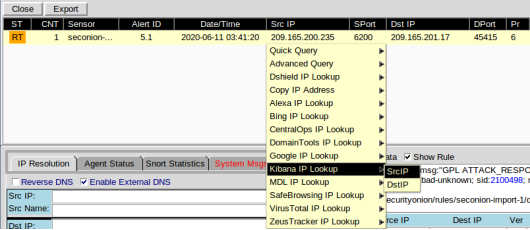
- Return to Sguil. Right-click either the source or destination IP for the alert ID 5.1 and select Kibana IP Lookup > SrcIP. Enter username analyst and password cyberops if prompted by Kibana.
Note: If you received the message “Your connection is not private”, click ADVANCED > Proceed to localhost (unsafe) to continue.
- If the time range is the last 24 hours, change it to June 2020 so June 11 is included in the time range. Use the Absolute tab to change the time range.
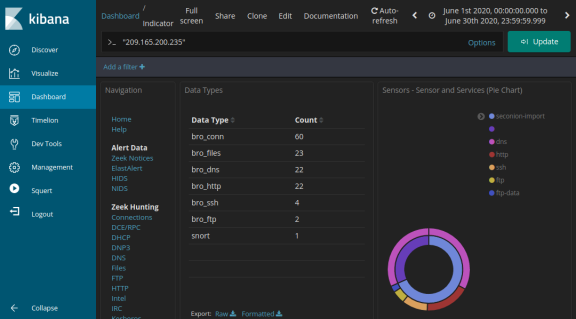
- In the displayed results, there is a list of different data types. You were told that the file confidential.txt is no longer accessible. In the Sensors – Sensors and Services (Pie Chart), ftp and ftp-data are present in the list, as shown in the figure. We will determine if FTP was used to steal the file.
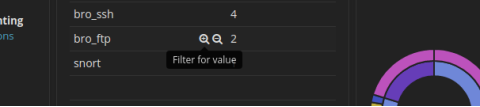
- Let’s filter for bro_ftp. Hover over the empty space next to the count of bro_ftp data types. Select + to filter for only FTP related traffic as shown in the figure.
- Scroll down to the All Logs section. There are two entries listed.
Questions:
What are the source and destination IP addresses and port numbers for the FTP traffic?
Type your answers here.
The source IP address and port number 192.168.0.11:52776. The destination IP address and port number is 209.165.200.235:21.
- Expand and review both log entries. In one of these entries, the ftp_argument has an entry of ftp://209.165.200.235/./confidential.txt. Also review the message in the log entry to learn more about this event.
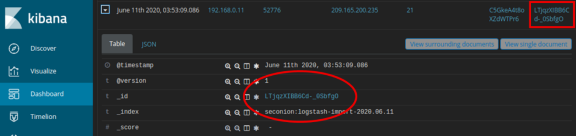
- Within the same log entry, scroll up back to the alert _id field and click the link.
- Review the transcript for the transactions between the attacker and the target. If desired, you can download the pcap and review the traffic using Wireshark.
Question:
What are the user credentials to access the FTP site?
Type your answers here.
Username analyst and password cyberops
- Now that you have verified that the attacker has used FTP to copy the content of the file confidential.txt and then deleted it from the target. So what is the content of the file? Remember one of the services listed in the pie chart is ftp_data.
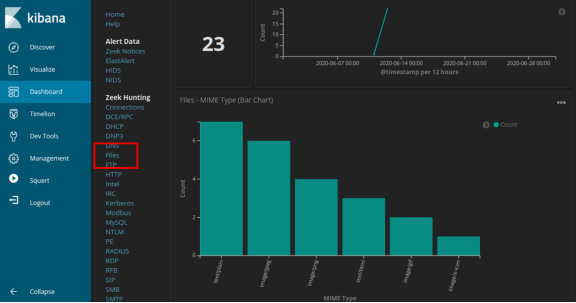
- Navigate to the top of the dashboard. Select Files under the Zeek Hunting heading in the left panel, as shown in the figure. This will allow you to review the types of the files that were logged.
Questions:
What are the different types of files? Look at the MIME Type section of the screen.
Type your answers here.
The file types are text and different types of image files in this example.
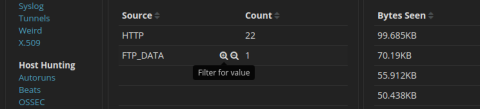
Scroll to the Files – Source heading. What are the file sources listed?
Type your answers here.
HTTP and FTP
- Filter for FTP_DATA by hovering over the empty space next to the Count for FTP_DATA and click +.
- Scroll down to review the filtered results.
Question:
What is the MIME type, source and destination IP address associated with the transfer of the FTP data? When did this transfer occur?
Type your answers here.
The file is a plain text file that were transfer from 192.168.0.11 to 209.165.200.235. The file was transferred on June 11, 2020 at 3:53.
- In the File logs, expand the entry associated with FTP data. Click the link associated with alert _id.
Question:
What is the text content of the file that was transferred using FTP?
Type your answers here.
CONFIDENTIAL DOCUMENT
DO NOT SHARE
This document contains information about the last security breach.
With all the information has gathered so far, what is your recommendation for stopping further unauthorized access?
Type your answers here.
At a minimum, the password for the username analyst should be changed throughout the network (209.165.200.235 and 192.168.0.11)